Week of Events
Making Thinking Visible
Making Thinking Visible
One of the gifts of teaching in the digital age is the ease of which a teacher can gather evidence of thinking and learning. Documentation can occur continuously allowing the assessment of student progress as well as the discovery of holes in their understanding. Each step of the thinking process can be recorded digitally using […]
Using Stop-animation Videos to Learn Concepts
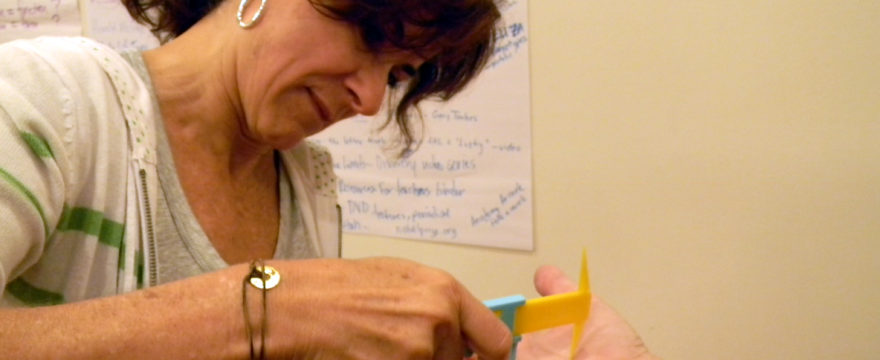
Using Stop-animation Videos to Learn Concepts
Stop-animation videos are short movies made with a series of photos taken from the same position and a handful of items that can be moved about to create a story. In this 1.5 hr. workshop, you will create your own stop-animation video of processes or phenomena, to cover main ideas or convey detailed information. Through […]
Writing and Speaking About Data (DBQs and FRQs)
Writing and Speaking About Data (DBQs and FRQs)
How do we talk about data? How do we write about data? In this 1.5 hr. workshop you will discover ways to help your student be specific, using the correct terms, in context, as they identify and describe trends in a set of numbers. We will play two games useful for building a working vocabulary […]
Statistics for Teaching Science: Part 4 Expressing Error on a Graph
Statistics for Teaching Science: Part 4 Expressing Error on a Graph
Error bars are placed on a graph to give a more detailed account of what was observed. Although there are many descriptors that can be used to draw error bars, in each case the value is used to express the uncertainty or variability of the data. Error bars created from certain calculations are especially informative […]