Statistics for Teaching Science: Part 1 Measuring and Reporting Uncertainty
All measurements include some degree of uncertainty or error, but how it is reported is decided by the person collecting the data. Because analysis is dependent on the data collected, the method used to report error can substantially impact the strength of the claims made and conclusions drawn. In this workshop, we will explore five […]
Statistics for Teaching Science: Part 2 The Problem with Describing Data Using the Mean
Often by middle school and certainly by high school, students default to the mean as the best way to describe data without much consideration for how they might defend that choice. So, you might think, what’s the harm in that? Everyone knows what is meant by this descriptor, it is familiar and understandable, easy to […]
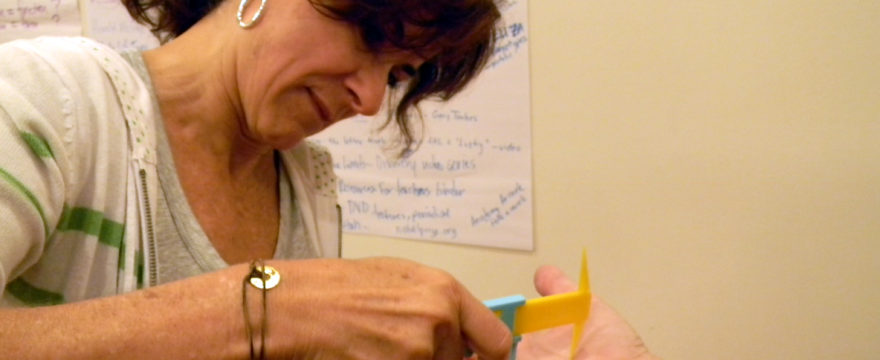
Developing and Using Models Part 2
In this 1.5-hour workshop, we will explore 3-dimensional modeling for use in Next Generation science and math courses. Helping prepare students for a career in science or mathematics requires a refined ability to engage in critical thinking about complex systems. Because models are analogies to define real-world processes, structures, or events, they are an efficient […]
Student-designed Experiments: Part 3 Guiding Students Through Data Analysis
Teachers will play the role of the students, collecting data in their own homes and pooling their observations and measurements in a spreadsheet shared by their lab partners. We will conduct data analysis within lab groups during the workshop to experience how this process can be performed using remote teaching and learning platforms. Peer critiques […]
Statistics for Teaching Advanced Science: Part 7 Hypothesis Testing Using Tests of Correlation
Parts 5-8 continue the Statistics for Science series to include the skills required in high school Advanced Placement (AP) and International Baccalaureate (IB) science courses. In these workshops, we will learn how and when to use each of the most common statistical tests that are used to test hypotheses. A hand-calculation will be done using […]
Statistics for Teaching Science: Part 3 Getting Comfortable with Variance, Standard Deviation, Standard Error of the Mean, and the 95% Confidence Interval
The variance, standard deviation, and standard error of the mean are excellent methods for describing data because they convey the variability of the observed data around the mean. Anyone teaching AP, IB, Pre-AP, Pre-IB, or college-bound science students will likely want to know how to calculate these values, what they indicate, and how to contextualize […]
Making Thinking Visible
One of the gifts of teaching in the digital age is the ease of which a teacher can gather evidence of thinking and learning. Documentation can occur continuously allowing the assessment of student progress as well as the discovery of holes in their understanding. Each step of the thinking process can be recorded digitally using […]
Using Stop-animation Videos to Learn Concepts
Stop-animation videos are short movies made with a series of photos taken from the same position and a handful of items that can be moved about to create a story. In this 1.5 hr. workshop, you will create your own stop-animation video of processes or phenomena, to cover main ideas or convey detailed information. Through […]
Writing and Speaking About Data (DBQs and FRQs)
How do we talk about data? How do we write about data? In this 1.5 hr. workshop you will discover ways to help your student be specific, using the correct terms, in context, as they identify and describe trends in a set of numbers. We will play two games useful for building a working vocabulary […]
Statistics for Teaching Science: Part 4 Expressing Error on a Graph
Error bars are placed on a graph to give a more detailed account of what was observed. Although there are many descriptors that can be used to draw error bars, in each case the value is used to express the uncertainty or variability of the data. Error bars created from certain calculations are especially informative […]